# Initialize Otter
import otter
grader = otter.Notebook("geography-globalization.ipynb")
# This coding cell imports some python libraries that we will be using throughout this notebook
# Don't worry about what they are, just run this cell before running any other cells below this one
from datascience import *
import numpy as np
#import otter
grader = otter.Notebook("geography-globalization.ipynb")
%matplotlib inline
import matplotlib.pyplot as plt
plt.style.use('fivethirtyeight')
from IPython.display import YouTubeVideoGlobalization & Agriculture
This activity’s goal is to review some of the material presented in the videos and lectures of module 3. In this section, we will be looking at data from the Food and Agriculture Organization (FAO) of the United Nations. Food globalization isn’t new, as long as people have been cooking, they’ve searched for exciting ingredients. As a result of trade agreements, and the industrialization of food production, the availability of food is now more impacted by economy than what you can grow in your region. According to the US food and drug administration, 55% of fruits and vegetables are produced abroad. Meaning, if our relationship with China goes south, our access to apples will be cut off (90% of apples consumed in the US are grown in China).
In this activity we want to consider how globalization has impacted availability of agricultural products, and how this bounty may increase food insecurity in some regions based on trade relationships.
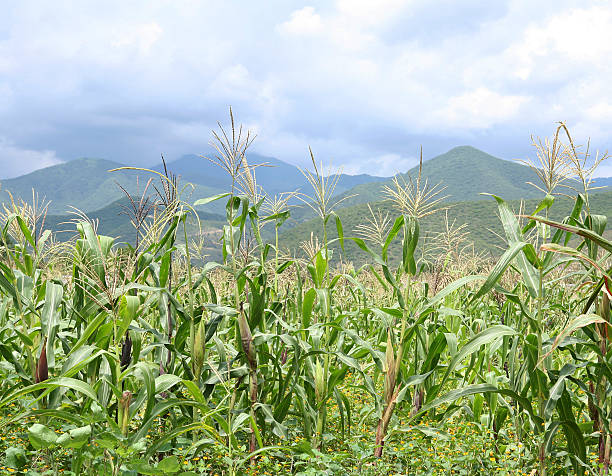
1. A Closer look at Corn (Maize): History
Before we dive into the data. Let’s learn a little more about the history of corn. Run the coding cell below and watch the TEDed talk!
# The original URL is:
# https://youtu.be/i6teBcfKpik

YouTubeVideo("i6teBcfKpik")
Question 1: After restrictions on corn production were removed by Nixon in the 1970s, the US corn yield exploded leading to corn used for thickening agents, sweeteners, and animal feed. This allowed for ___________:
inexpensive meat production
increased vegetarian diets
midscale organic production to grow
all of these are correct
In the next coding cell, set the variable after_restrictions equal to the correct answer/number (1, 2, 3, or 4).
# Set the variable after_restrictions equal to 1, 2, 3, or 4
after_restrictions = ...grader.check("q1")2. Corn Production around the world
Now that we learned a bit more about the history of corn, let’s have a look at some data. In this section, we will focus on the global production of corn from 1961 to 2020. The dataset we will explore comes from the Food and Agriculture Organization of the United Nations https://
Just run the code cell below to:
STEP 1: Upload the dataset in our notebook as a table.
STEP 2: Create a plot to visualize the table data.
# Complete data
corn_Production = Table.read_table('https://cal-icor.github.io/textbook.data/sbcc/geog-102/FAOSTAT_maizeProduction_World_Americas.csv')
corn_Production.show(3)
# World
corn_Production_World = corn_Production.where('Area', 'World').where('Element','Production')
corn_Production_World.plot('Year', 'Value')
corn_prodTitle = plt.title('World Corn Production over time\n in tons')
Question 2: What are your observations on how has the production of corn changed over time?
Type your answer here, replacing this text.
3. Corn Export - USA versus Mexico
Let’s narrow in and compare data from 2 countries: USA and Mexico. Do both countries see similar trends over time? Let’s look at the export of corn for both.
# Corn export quantity and value in the USA
# Data from https://www.fao.org/faostat/en/#data/TCL
# Trade>Crops & Livestoc products/USA/Export quantity/value
corn_export_World= Table.read_table('https://cal-icor.github.io/textbook.data/sbcc/geog-102/FAOSTAT_Maize_Export_World.csv')

def plotCornExport(myTable, countryName):
    corn_export_country = myTable.where('Area',countryName)
    corn_export_quantity = corn_export_country.where('Element','Export Quantity').select('Year', 'Value').relabeled('Value','Maize Export Quantity in tons')
    corn_export_value = corn_export_country.where('Element','Export Value').select('Year', 'Value').relabeled('Value','Maize Export Value in 1000 US$')
    corn_export = corn_export_quantity.join('Year', corn_export_value, 'Year')
    #corn_export_value.plot('Year')
    corn_export.plot('Year')

    plt.title('Maize Export\n'+ countryName)

plotCornExport(corn_export_World, 'United States of America')
plotCornExport(corn_export_World, 'Mexico')
Question 3: Is there a specific year(s) that pops out when looking at the visualizations above? How does this correspond to the TEDed Talk on the history of corn? Do we see the same thing when looking at both countries?
Type your answer here, replacing this text.
4. Corn uses - USA versus Mexico
When you think about corn and how we use it, what do you think about?
Maybe you think of something yummie like this: 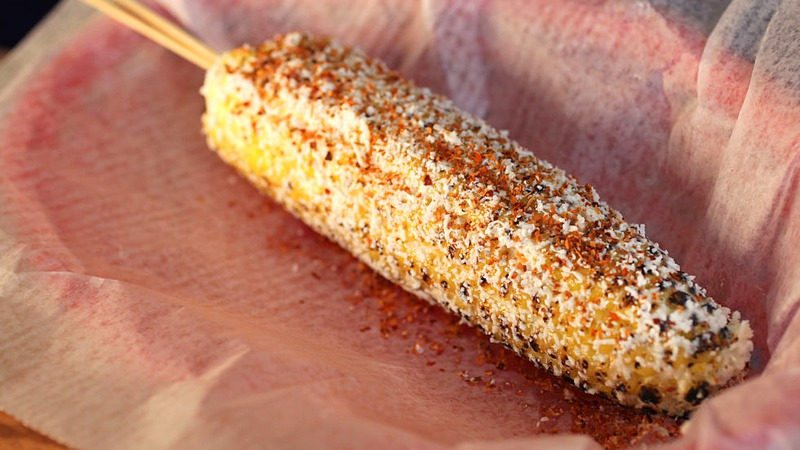 But is corn mostly used to feed the human population?
Before we get hungry, let’s take a look at some data...
STEP 1: Gather and load the data in tabular format
STEP 2: Visualize...
Just run the cell below and have a look at some data. The data was collected and made available by the FAO (Food and Agriculture Organization of the United Nations)
# Corn uses 2010 - now
# Data from https://www.fao.org/faostat/en/#data/TCL
# Food Balances>Food Balances(2010-)/USA/Food vs Feed vs Processed vs Exported vs Other uses
corn_uses = Table.read_table('https://cal-icor.github.io/textbook.data/sbcc/geog-102/FAOSTAT_Maize&Products_FoodBalances.csv')
#corn_uses.show(3)

def plotCornUses(myTable, countryName):
    corn_uses_country = myTable.where('Area', countryName).select('Year','Element','Value')
    corn_uses_food= corn_uses_country.where('Element','Food').select('Year', 'Value').relabeled('Value','Food')
    corn_uses_feed= corn_uses_country.where('Element','Feed').select('Year', 'Value').relabeled('Value','Feed')
    corn_uses_processing= corn_uses_country.where('Element','Processing').select('Year', 'Value').relabeled('Value','Processing')
    corn_uses_other= corn_uses_country.where('Element','Other uses (non-food)').select('Year', 'Value').relabeled('Value','Other uses (non-food)')
    corn_uses_country = corn_uses_food.join('Year', corn_uses_feed, 'Year').join(
        'Year', corn_uses_processing, 'Year').join('Year', corn_uses_other, 'Year')
    corn_uses_country.plot('Year')
    plt.title("Corn Use\n"+countryName)

plotCornUses(corn_uses, 'Mexico')
plotCornUses(corn_uses, 'United States of America')
Question 4: Now that we see some data. What is corn (Maize) mostly used for in the USA? In the next coding cell, set the variable corn_use equal to the number 1, 2, 3 or 4 according to the following:
Food
Feed
Processing
Other uses (non-food)
corn_use = ...grader.check("q4")Now that corn is integrated into the global economy it’s difficult to see a way to disentangle it from global food production. As seen in the video on corn, products from maize have links to obesity, climate change, water scarcity and more.
Question 5: What is a possible solution to our reliance on corn? Think of a way we can minimize the impact of corn production and/or ween ourselves off maize.
Type your answer here, replacing this text.
CONGRATULATIONS! You just finished the jupyter notebook assignment for module 3! Be sure to...
run all of the tests and verify that they all pass,
check your answers for the open response questions,
choose Download as PDF from the File menu,
submit the .pdf file on canvas.
Notebook developed by:
Nathalie Guebels, Assistant Professor, Computer Science, Santa Barbara City College
Geordie Armstrong, Assistant Professor, Geography, Santa Barbara City College